Cut the noise. See the market's real structure.
Most tools start with the stock. NiveshEdge starts with the market. It reads the full Nifty 500 for breadth and market health, then ranks all 31 sectors on momentum and participation — so you know whether the market is rewarding risk at all, and where capital is actually moving, before you look at a single name. No recommendations. No opinions. Just the market, decoded.
Your research process is costing you clarity.
Same flow, every session.
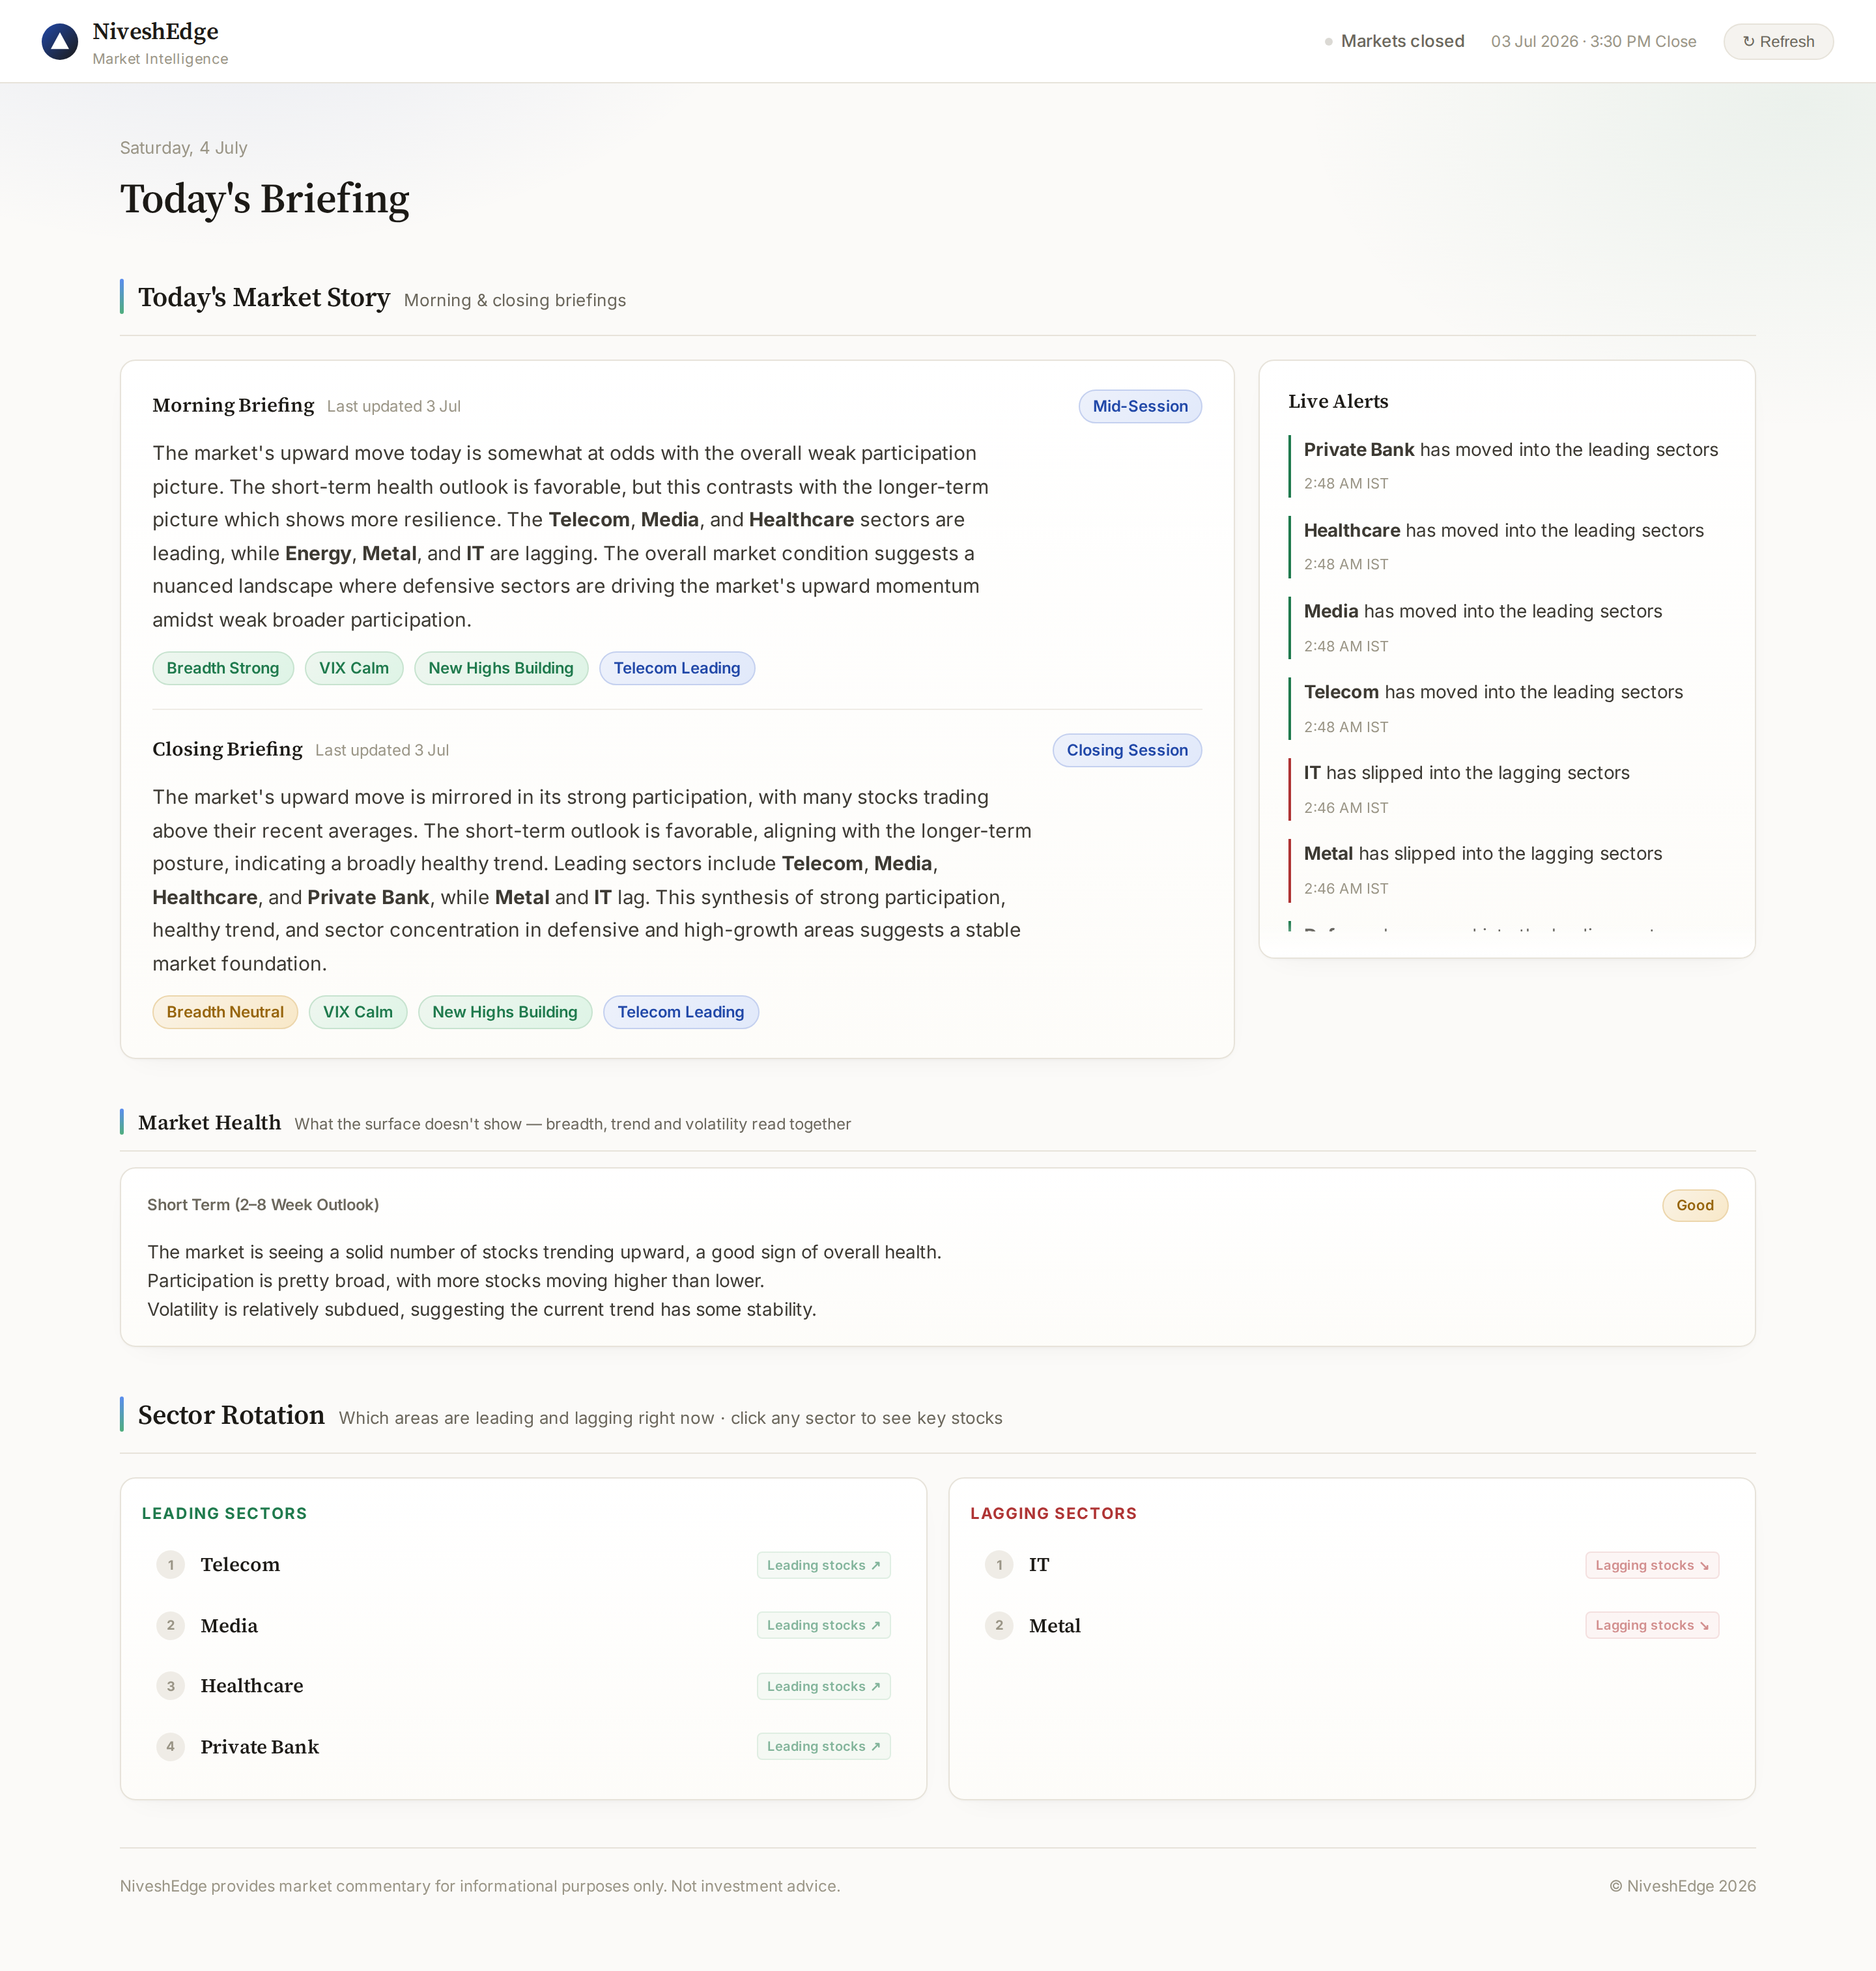
One brief a day at 3:15 PM, with Market Health and Sector Rotation underneath — what moved, and why.
3:15 PM Market Brief
One written brief every market day, published at 3:15 PM — after the session has shown its hand and before the close. What moved, what changed, and what it means for tomorrow.
Market Health
A plain-language read on whether the market is in good shape or under pressure — built on breadth, participation, and momentum across the full Nifty 500, not a blended mood score.
Sector Rotation
A clear call-out of which sectors are leading and which are lagging right now, decoded in plain language so you know exactly where the market's attention is.
Built on mechanism, not metrics.
Each principle below describes a specific, verifiable mechanism behind the platform — not an adoption metric.
A Framework, Not a Feed.
Market health, then sector rotation, then participation — the order a professional desk works in, encoded to run every session. The scoring models are proprietary, weighted from years of trading this market, then translated into plain language every session.
Reads the Whole Market, Not Just the Index.
The Nifty 50 index can look perfectly fine while the market underneath is quietly deteriorating. NiveshEdge reads all 500 stocks — breadth, participation, and rotation — so you see what the index price hides.
Fresh Every Session. Never Recycled.
Every briefing is generated from live market data — not a template pulled from yesterday, not a summary that silently rewrites itself. What you read at 10 AM reflects exactly what the market did this morning.
No Predictions. No Opinions.
NiveshEdge tells you what the data shows — nothing more. No forecasts, no analyst views, no directional calls. The market speaks; we translate.
Founding Members Program
We will soon be live. No payment required for our first 500 founding members — just full access, from day one.